By Greg Bunce on Jun 30, 2016
Mapping Utah’s Wireless Emergency Call Routing System
This article will take 3 minutes to read
AGRC recently assisted the Utah Communications Authority (UCA) on a project to map and analyze wireless 911 call delivery across Utah. The goal of the project was to provide local 911 communication centers (known formally as Public Safety Answering Points or PSAPs) with maps that will assist them in reviewing and, where applicable, suggesting changes to the wireless providers, that should improve the overall performance of the 911 system.
 Typically, each cell tower has one or more antennas which are referred to as sectors. A caller’s geographic location determines the sector that provides the instantaneous voice and data service. And, each sector is programmed to deliver any 911 calls it receives to a specific 911 PSAP center. For 911 calls, seconds can save lives, so it’s critical that each sector routes a 911 call to the appropriate PSAP as this eliminates both confusion and the possibility of having to transfer the call to another center. Routing sheets, maintained by the wireless providers, catalog all the sectors with their location, direction, beam width, service distance, and the assigned PSAP center for 911 calls.
For several years, the State-level 911 program has been tracking 911 call performance statistics, statewide, including the number of call transfers. It is hoped that this map analysis project, comparing the sector service areas with the statewide PSAP center jurisdictional boundary layer and additional geographic context, will make measurable improvements.
Before developing the GIS map analysis process, we asked around, unsuccessfully, to see if this had been done in other states. Then, finding no examples to work from, we set about defining the analysis process – one that would be repeatable and that could be automated as much as possible. Here’s a description…
The first step was to obtain the routing sheets from West (formerly Intrado), which contracts with the Utah 911 system to provide data services. The routing sheets contain data for each cell sector including location (lat/long), beamwidth, azimuth, and range. We requested routing sheets for the four national cell providers in the state (AT&T, Sprint, T-Mobile, and Verizon). This data, however, is tabular so we needed to convert it to spatial data for use in our GIS. Using scripts developed in-house, we spatially mapped each cell sector in the routing sheets, projecting its location and broadcast extent (see Map 1).
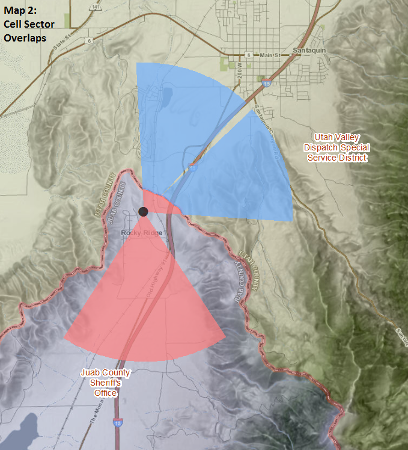
 The next step was to look at each sector’s broadcast in relation to AGRC’s PSAP boundaries. Using ArcGIS Desktop spatial analysis and geoprocessing we intersected both datasets to determine the PSAP, or portion of the PSAP, each sector’s broadcast overlapped. Essentially, this process produced a new GIS layer with attributes from both the original routing sheets as well as attributes from its overlapping PSAP boundary (see Map 2).
Now with attributes from both dataset, we were able to query the data and map where sectors were split between two or more PSAP areas. Of these sectors, we chose to focus the project on sectors where greater than fifty-percent of the broadcast area resides in the adjacent PSAP.
The final step of the project was to make a map document for each sector where this overlapping occurred. We automated the map production process (ArcGIS data-driven pages) and organized them by PSAP area as well as wireless provider. The final product was a set of maps, per provider, for each PSAP showing these specific sectors that the analysis concluded needed a review.
Future phases of this project have been discussed and may include plotting call location densities on the map. At present, a link between the call location log and the sectors serving the calls, is not possible, but we are in the process of recommending changes that will make it possible to map the call locations for specific sectors. This would enable the PSAPs, when making routing decisions, to better understand the geographic extent of the cell sector areas by displaying the location of the calls within them, relative to their own boundaries.
For this phase, it is our recommendation that each PSAP further investigate and review these sectors and, if necessary, submit change requests, through West, to the appropriate wireless providers.
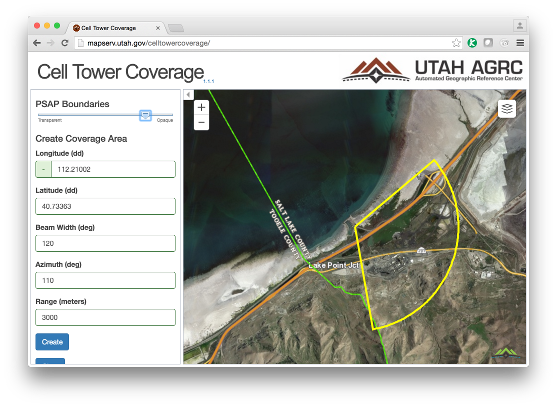
 For local validation of our results, and to allow for future ad-hoc analysis of new or updated sectors, we’ve created the Utah sector analysis and visualization tool (view web app source code in GitHub).
Ultimately, taken together, these efforts should help improve 911 call response time and cut down on emergency call transfers between the PSAPs.